Produces visual summaries for objects returned by
brs_marginaleffects.
Arguments
- object
An object of class
"brs_marginaleffects".- type
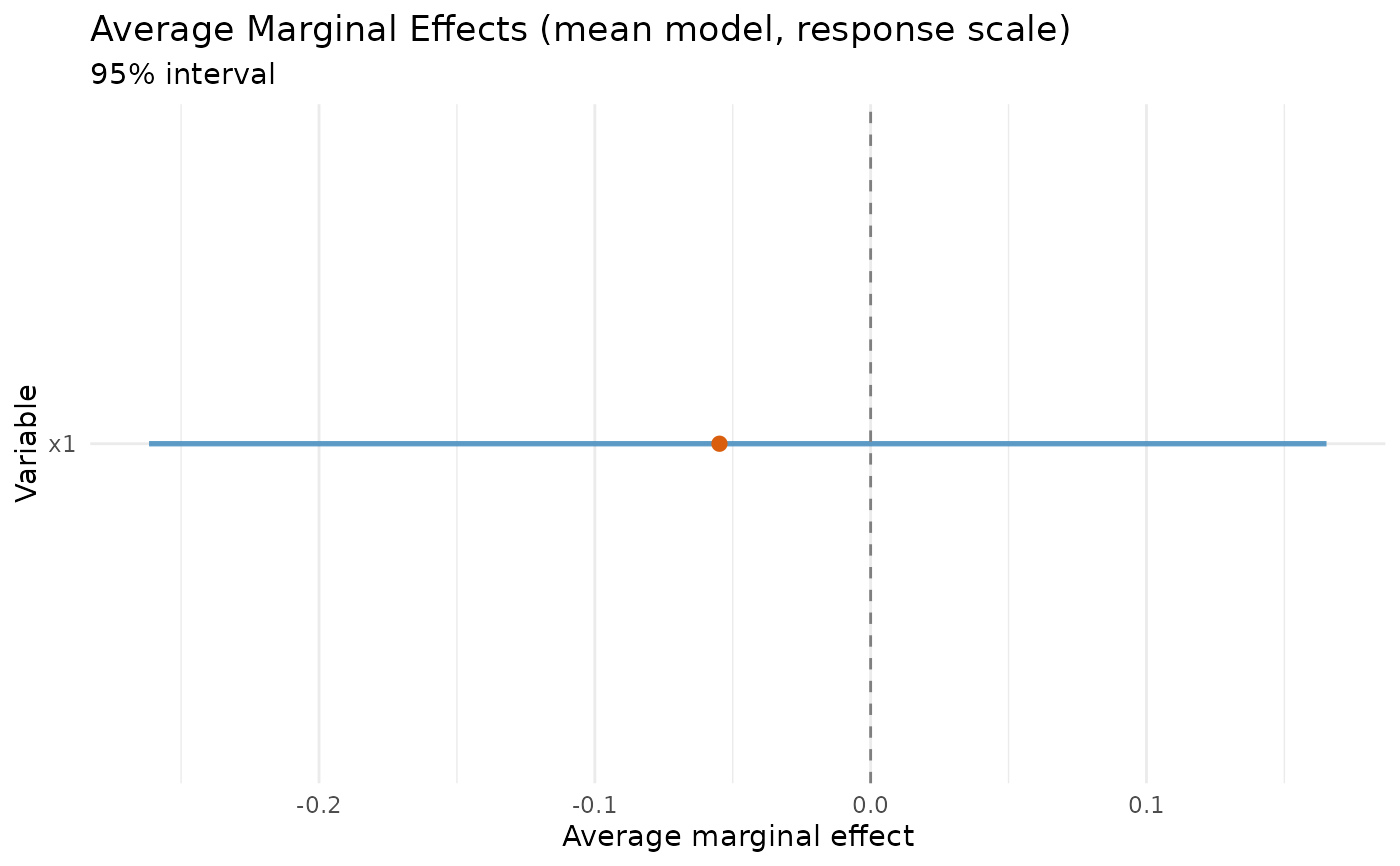
Plot type:
"forest","magnitude", or"dist".- variable
Optional variable name for
type = "dist".- top_n
Maximum number of variables shown in
"magnitude"(ordered by|AME|).- title
Optional plot title override.
- caption
Optional subtitle override.
- theme
Optional ggplot2 theme object. If
NULL,ggplot2::theme_minimal()is used.- ...
Currently ignored.
Details
type = "dist" requires AME simulation draws stored in
attr(object, "ame_draws"), which are available when marginal
effects are computed with keep_draws = TRUE and interval = TRUE.
Examples
# \donttest{
dat <- data.frame(
  y = c(
    0, 5, 20, 50, 75, 90, 100, 30, 60, 45,
    10, 40, 55, 70, 85, 25, 35, 65, 80, 15
  ),
  x1 = rep(c(1, 2), 10)
)
prep <- brs_prep(dat, ncuts = 100)
#> brs_prep: n = 20 | exact = 0, left = 1, right = 1, interval = 18
fit <- brs(y ~ x1, data = prep)
ame <- brs_marginaleffects(fit)
ggplot2::autoplot(ame, type = "forest")

# }
# }