Produces visual summaries for objects returned by brs_bootstrap.
Arguments
- object
An object of class
"brs_bootstrap".- type
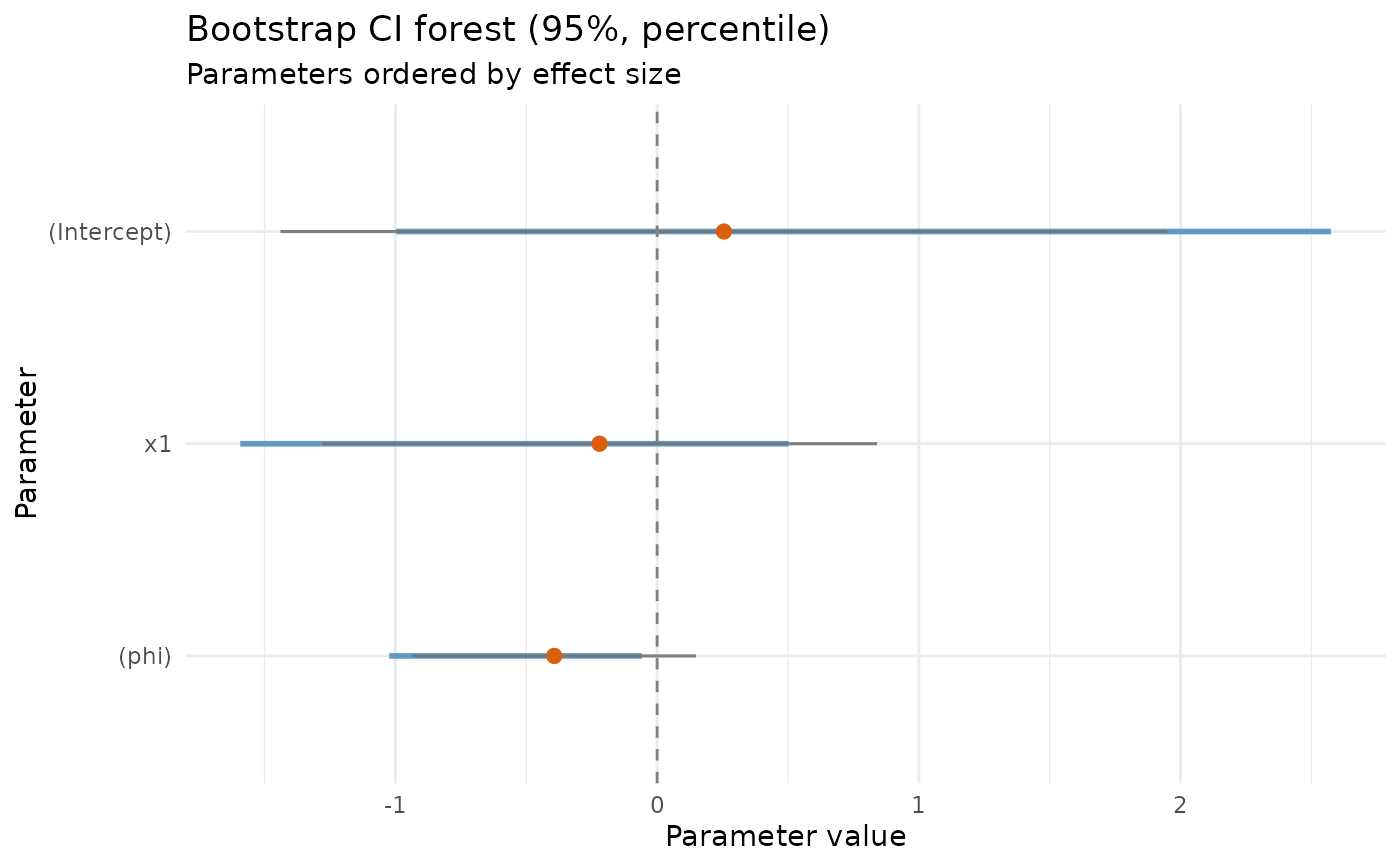
Plot type:
"ci_forest","dist","qq", or"stability".- parameter
Optional parameter name used by
type = "dist","qq", and"stability". IfNULL, the first parameter is used.- title
Optional plot title override.
- caption
Optional subtitles/titles for plot types. Accepts:
a single string (used for the selected
type);a character vector/list with up to four entries in the order
ci_forest,dist,qq,stability.
- max_parameters
Maximum number of parameters shown in
type = "ci_forest".- ci_level
Confidence level used in
type = "stability". Defaults to the level stored inobject.- theme
Optional ggplot2 theme object (e.g.,
ggplot2::theme_bw()). IfNULL,ggplot2::theme_minimal()is used.- ...
Currently ignored.
Details
For type = "dist", "qq", and "stability",
bootstrap draws must be present in attr(object, "boot_draws"),
obtained by fitting with brs_bootstrap(..., keep_draws = TRUE).
Examples
# \donttest{
dat <- data.frame(
  y = c(
    0, 5, 20, 50, 75, 90, 100, 30, 60, 45,
    10, 40, 55, 70, 85, 25, 35, 65, 80, 15
  ),
  x1 = rep(c(1, 2), 10)
)
prep <- brs_prep(dat, ncuts = 100)
#> brs_prep: n = 20 | exact = 0, left = 1, right = 1, interval = 18
fit <- brs(y ~ x1, data = prep)
boot <- brs_bootstrap(fit, R = 50)
ggplot2::autoplot(boot, type = "ci_forest")

# }
# }